ENVISION DataCube: Powering Advanced Agricultural Insights
ENVISION’s Open DataCube (ODC) technology is at the heart of transforming Earth observation (EO) data into actionable agricultural insights. By organizing large amounts of satellite data into an accessible format, ODC enables us to deliver precise, timely, and relevant information to support sustainable agricultural practices.
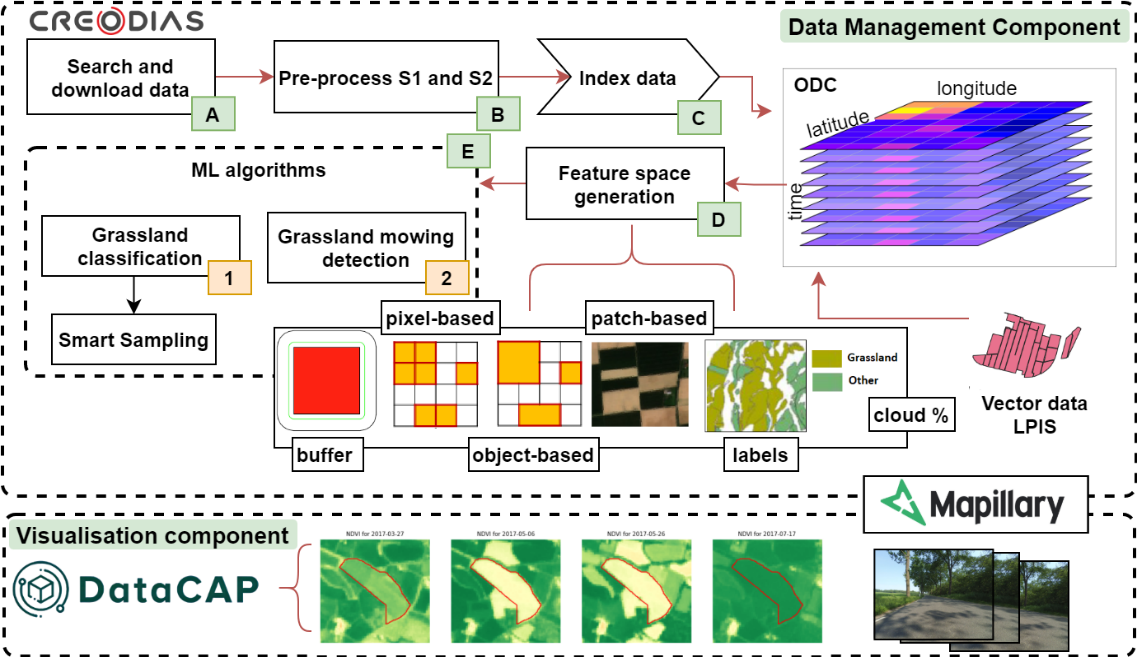
Core Features of ENVISION DataCube
- Robust Data Management: ODC efficiently handles and organizes large datasets from Sentinel-1 and Sentinel-2 satellites (or other metadata), making them readily available for analysis and application in various agricultural monitoring tasks.
- Analysis Ready Data (ARD): The DataCube ensures that all data are pre-processed to a state of readiness for analysis, removing barriers to immediate use and enabling quicker insights into agricultural conditions.
- Dynamic Data Products: Leveraging the power of ODC, ENVISION creates dynamic data products tailored to specific agricultural monitoring needs, such as crop type mapping, soil condition monitoring, and vegetation analysis.
- Nationwide Monitoring Capabilities: The scalable nature of ODC allows for efficient nationwide monitoring, providing detailed insights into agricultural practices across large geographical areas.
Benefits for Agriculture Stakeholders
- Data-Driven Decisions: Access to comprehensive and timely data supports informed decision-making, helping farmers, agronomists, and policymakers optimize their practices and strategies.
- Enhanced Monitoring Efficiency: With data readily available and analysis-ready, stakeholders can monitor agricultural lands more efficiently, identifying trends, changes, and areas requiring attention.
- Support for Compliance and Sustainability: The detailed insights provided by the DataCube support adherence to agricultural policies and contribute to sustainable farming practices, aligning with environmental and regulatory standards.
Explore the Possibilities with ENVISION DataCube
Dive into the world of advanced agricultural monitoring with ENVISION's DataCube technology. Discover how data-driven insights can transform your agricultural practices, enhance sustainability, and support informed decision-making in the ever-evolving agricultural sector.
Explore More
Take advantage of the capabilities and applications of ENVISION DataCube. Request a demo!
Get involved
Discover how ENVISION is tailored to meet the specific needs of different business cases, providing tailored solutions for sustainable agriculture monitoring.
Developed by NOA